Curves
| Authors: | J David Eisenberg; Arihant Parsoya (p5 port) |
|---|---|
| Copyright: | If you see any errors or have comments, please let us know. The tutorial was ported to p5 by Arihant Parsoya. If you see any errors or have comments, open an issue on either the p5 or Processing repositories. |
This short tutorial introduces you to the three types of curves in Processing: arcs, spline curves, and Bézier curves.
Arcs
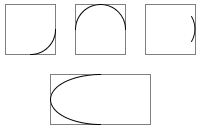
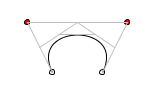
Arcs are the simplest curves to draw. Processing defines an arc as a section of an ellipse. You call the function with these parameters:
arc((x, y), width, height, start, stop)
The first four parameters are the same as the ones for ellipse() they define the boundary box for your arc. The last two parameters are the starting and ending angle for the arc. These angles, as with all other angles in Processing, are given in radians. Remember that angles are measured clockwise, with zero degrees pointing east. Using the fact that PI radians equals 180°, here are some example arcs.
from p5 import *

def setup():
        size(300, 200)
        background(255)

        rect_mode('CENTER')
        stroke(128)
        rect((35, 35), 50, 50)
        rect((105, 35), 50, 50)
        rect((175, 35), 50, 50)
        rect((105, 105), 100, 50)

        stroke(0)
        arc((35, 35), 50, 50, 0, PI / 2.0) # lower quarter circle
        arc((105, 35), 50, 50, -PI, 0)  # upper half of circle
        arc((175, 35), 50, 50, -PI / 6, PI / 6) # 60 degrees
        arc((105, 105), 100, 50, PI / 2, 3 * PI / 2) # 180 degrees


if __name__ == '__main__':
        run()
Spline Curves
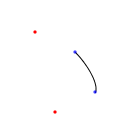
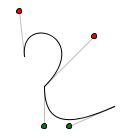
Arcs are fine, but they’re plain. The next function, curve(), lets you draw curves that aren’t necessarily part of an arc. This function draws what is technically called a Rom-Catmull Spline. To draw the curve, you have to specify the (x, y) coordinates of the points where the curve starts and ends. You must also specify two control points which determine the direction and amount of curvature. A call to curve() uses these parameters:
curve((cpx1, cpy1), (x1, y1), (x2, y2), (cpx2, cpy2))
Here is an example that shows a curve(). The control points are shown in red and the curve points in blue.
from p5 import *

def setup():
        size(200, 200)
        no_loop()

def draw():
        background(255)
        stroke(0)
        curve((40, 40), (80, 60), (100, 100), (60, 120))
        fill(255, 0, 0)
        ellipse((40, 40), 3, 3)
        fill(0, 0, 255, 192)
        ellipse((100, 100), 3, 3)
        ellipse((80, 60), 3, 3)
        fill(255, 0, 0)
        ellipse((60, 120), 3, 3)

if __name__ == '__main__':
        run()
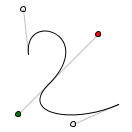
How do the control points affect the way the curve looks? Take a deep breath, because this is somewhat complicated.
- The tangent to the curve at the start point is parallel to the line between control point one and the end of the curve. These are the lines shown in green in the diagram at the left.
- The tangent to the curve at the end point is parallel to the line between the start point and control point 2. These are the lines shown in purple in the diagram at the left.
Continuous Spline Curves
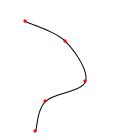
In isolation, a single curve() is not particularly appealing. To draw a continuous curve through several points, you are better off using the curve_vertex() function. You can only use this function when you are creating a shape with the begin_shape() and end_shape() functions.
Here is a curve connecting the points (40, 40), (80, 60), (100, 100), (60, 120), and (50, 150). In common usage, people use the first point of the curve as the first control point and the last point of the curve as the last control point.
from p5 import *

coords = [40, 40, 80, 60, 100, 100, 60, 120, 50, 150]

def setup():
        size(200, 200)

def draw():
        no_fill()
        background(255)
        stroke(0)
        begin_shape()
        curve_vertex(40, 40) # the first control point
        curve_vertex(40, 40) # is also the start point of curve
        curve_vertex(80, 60)
        curve_vertex(100, 100)
        curve_vertex(60, 120)
        curve_vertex(50, 150) # the last point of curve
        curve_vertex(50, 150) # is also the last control point
        end_shape()

        # Use the array to keep the code shorter;
        # you already know how to draw ellipses!
        fill(255, 0, 0)
        no_stroke()

        for i in range(0, len(coords), 2):
                ellipse((coords[i], coords[i + 1]), 3, 3)


if __name__ == '__main__':
        run()
Bézier Curves
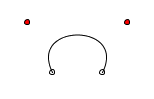
Though better than arcs, spline curves don’t seem to have those graceful, swooping curves that say “art.” For those, you need to draw Bézier curves with the bezier() function. As with spline curves, the bezier() function has eight parameters, but the order is different:
Here is a program that displays a Bézier curve and its control points.
from p5 import *

coords = [40, 40, 80, 60, 100, 100, 60, 120, 50, 150]

def setup():
        size(150, 150)

def draw():
        background(255)
        ellipse((50, 75), 5, 5) # endpoints of curve
        ellipse((100, 75), 5, 5)
        fill(255, 0, 0)
        ellipse((25, 25), 5, 5)  # control points
        ellipse((125, 25), 5, 5)
        no_fill()
        stroke(0)
        bezier((50, 75), (25, 25), (125, 25), (100, 75))

if __name__ == '__main__':
        run()
While it is difficult to visualize how the control points affect a curve(), it is slightly easier to see how the control points affect Bézier curves. Imagine two poles and several rubber bands. The poles connect the control points to the endpoints of the curve. A rubber band connects the tops of the poles. Two more rubber bands connect the midpoints of the poles to the midpoint of the first rubber band. One more rubber band connects their midpoints. The center of that last rubber band is tied to the curve. This diagrams helps to explain:
Continuous Bézier Curves
Just as curve_vertex() allows you to make continuous spline curves, bezier_vertex() lets you make continuous Bézier curves. Again, you must be within a begin_shape() / end_shape() sequence. You must use vertex(startX, startY) to specify the starting point of the curve. Subsequent points are specified with a call to:
bezierVertex((cpx1, cpy1), (cpx2, cpy2), (x, y));
cpx1, cpy1      Coordinates of the first control point
cpx2, cpy2      Coordinates of the second control point
x, y            The next point on the curve
So, to draw the previous example using bezier_vertex(), you would do this:
from p5 import *

coords = [40, 40, 80, 60, 100, 100, 60, 120, 50, 150]

def setup():
        size(150, 150)

def draw():
        background(255)
        # Don't show where control points are
        no_fill()
        stroke(0)
        begin_shape()
        vertex(50, 75) # first point
        bezier_vertex(25, 25, 125, 25, 100, 75)
        end_shape()

if __name__ == '__main__':
        run()
Here is a continuous Bézier curve, but it doesn’t join smoothly. The diagram shows the control points, but only the relevant code for drawing the curve is here.
from p5 import *

coords = [40, 40, 80, 60, 100, 100, 60, 120, 50, 150]

def setup():
        size(200, 200)

def draw():
        background(255)
        no_fill()
        begin_shape()
        vertex(30, 70) # first point
        bezier_vertex(25, 25, 100, 50, 50, 100)
        bezier_vertex(50, 140, 75, 140, 120, 120)
        end_shape()

if __name__ == '__main__':
        run()
In order to make two curves A and B smoothly continuous, the last control point of A, the last point of A, and the first control point of B have to be on a straight line. Here is an example that meets those conditions. The points that are in a line are shown in bold.
from p5 import *

coords = [40, 40, 80, 60, 100, 100, 60, 120, 50, 150]

def setup():
        size(200, 200)

def draw():
        background(255)
        no_fill()
        begin_shape()
        vertex(30, 70) # first point
        bezier_vertex(25, 25, 100, 50, 50, 100)
        bezier_vertex(20, 130, 75, 140, 120, 120)
        end_shape()

if __name__ == '__main__':
        run()
Summary
- Use
arc()when you need a segment of a circle or an ellipse. You can’t make continuous arcs or use them as part of a shape. - Use
curve()when you need a small curve between two points. Use curveVertex() to make a continuous series of curves as part of a shape. - Use
bezier()when you need long, smooth curves. Usebezier_vertex()to make a continuous series of Bézier curves as part of a shape.